
Self-organizing Map -- unsupervised neural network
- 4 minsWhat is unsupervised learning?
Unsupervised machine learning is the machine learning task of inferring a function that describes the structure of “unlabeled” data. The goal for unsupervised learning is to detect some pattern behind a mass of data without any prior knowledge about the data. Sounds like roman policier? That’s right!
Since the beginning of this field, a lot of unsupervised learning algorithms has been developed and applied widely. Algorithms like K-Means, hierarchical clustering, and principal component analysis are crucial tools in industry and academia.
Here is a useful link that explains the concepts of unsupervised learning in more detail.
What is a self-organizing map?
a self-organizing map (SOM) is an amazing neural network. The number of published research papers related to a self-organizing map ranked the first place from 2010 to 2015.
In this neural network, the output layer is a grid in which each neuron represents a value that tries to approximate the corresponding input value. The interesting part is that each neuron is actually a weight that needs to be tuned throughout the training process. The goal for this neuron network is to learn the representation of all input data points on neurons of the output grid and then cluster the data via similarities between neurons.

The major parameter is the number of neurons in the grid, called prototypes. The initialization of weights, learning rates and stopping criteria are the same as those of other neural networks.
As we can see from the left, each data point is mapped to a neuron that best approximates the value of that data point. Notice that the learning process is to adjust weights so that we minimize the "distance" between the input data point and the neuron that represents it.

The most magic part about a self-organizing map is that it is topologically preserved meaning that the neighbors of the original data point *A* will be mapped to the neighbors of *A's* representation in the output grid.
This property makes a self-organizing map unique among all clustering algorithms. Since topological preservation can help the neural network recognize the patterns easily when the number of clusters is huge, a self-organizing map is especially good at recognizing terrains.
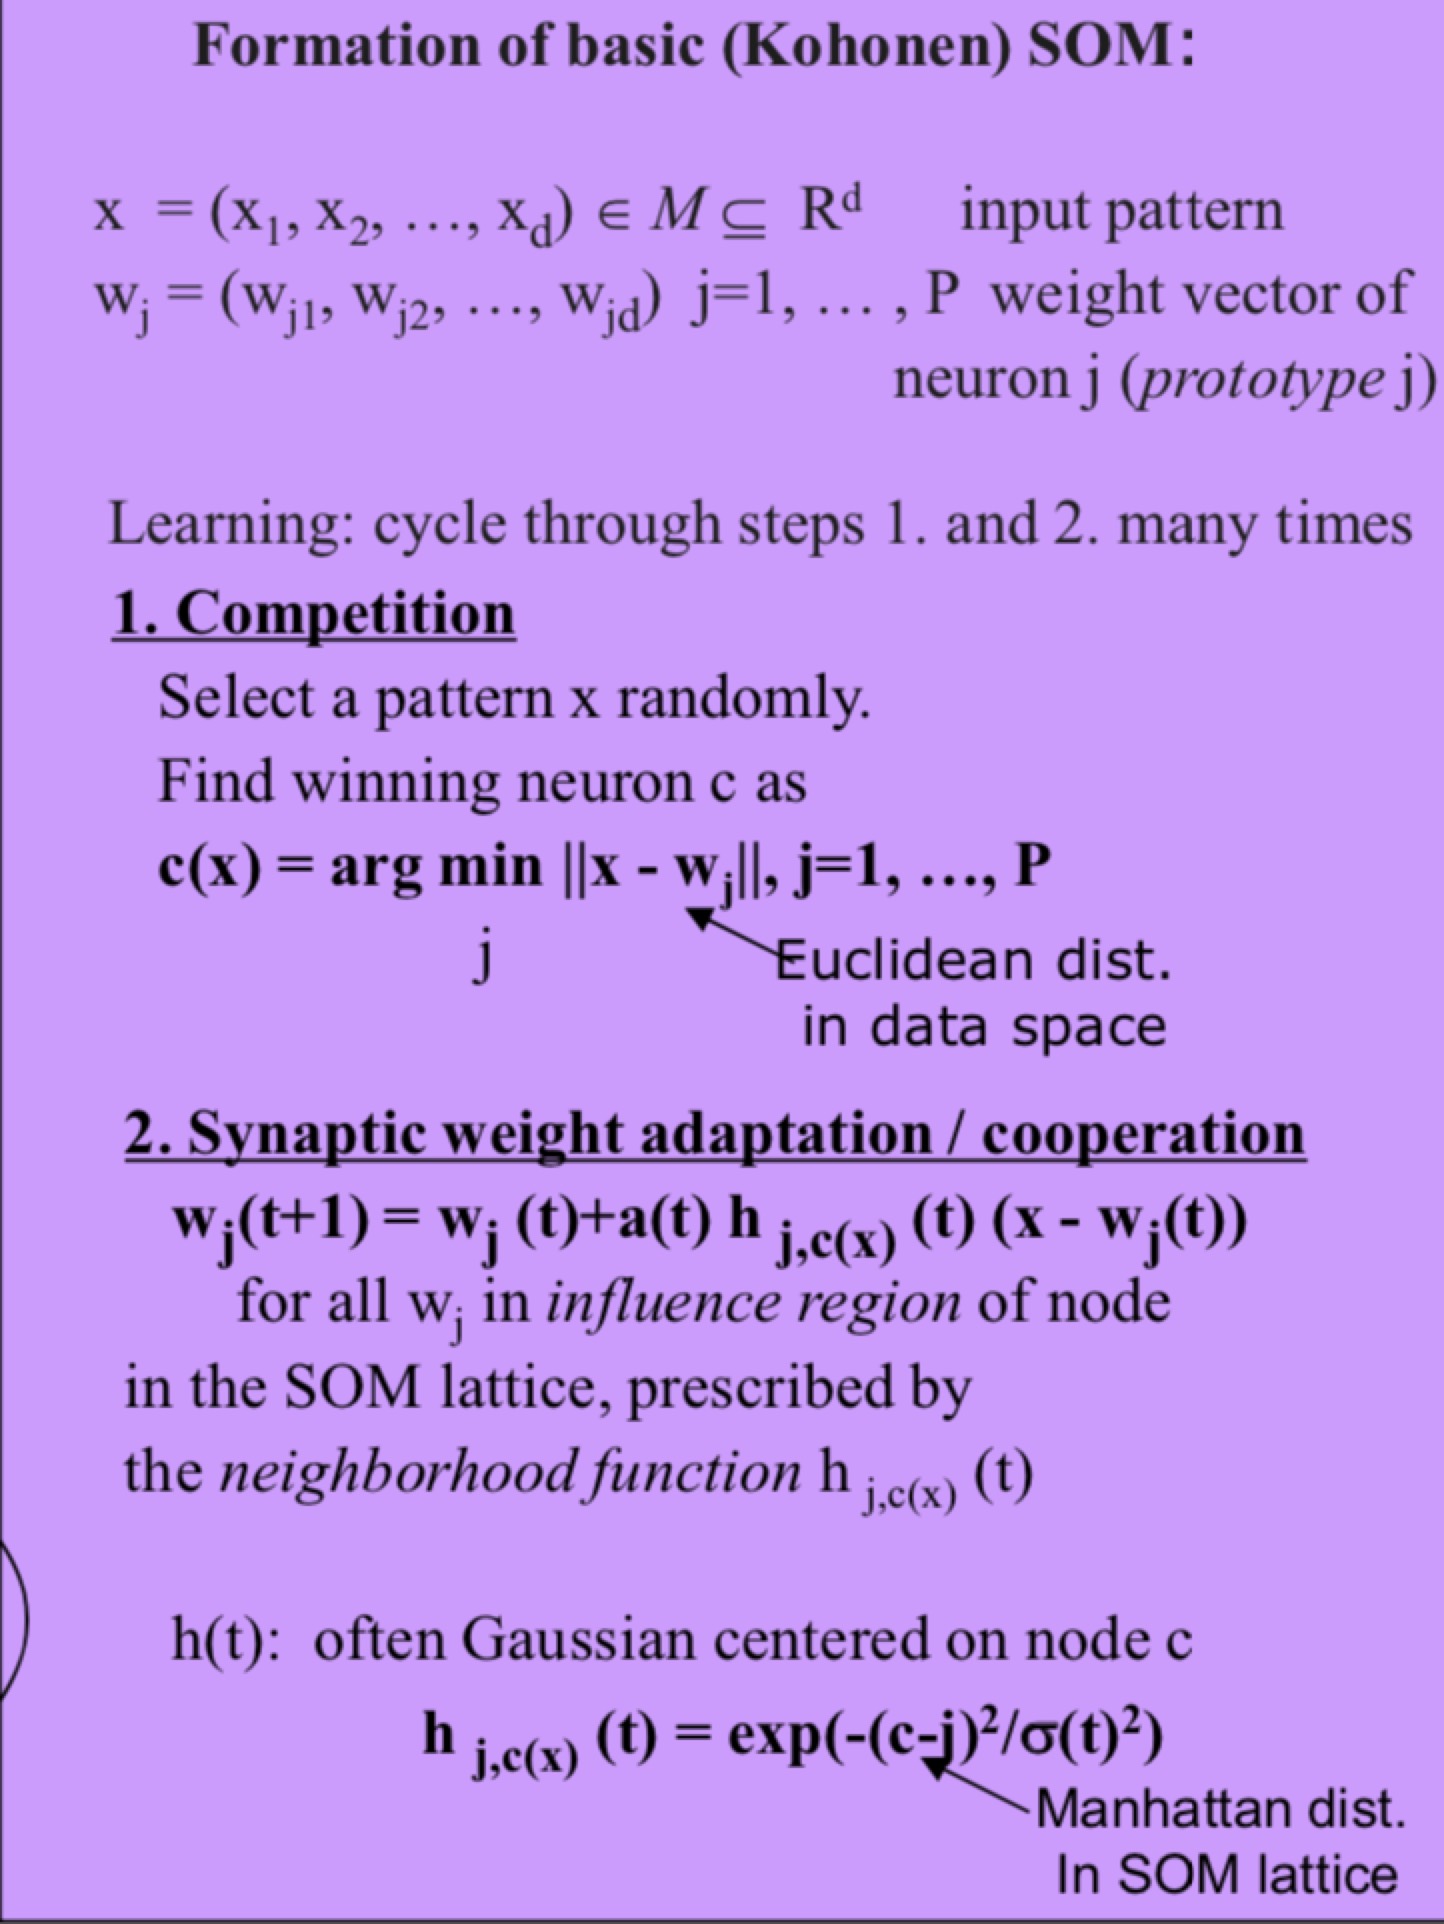
Here comes the mathematical formula for SOM. As we can see, one round of training consists of two steps. The first one is a competition algorithm where we will choose a prototype closest to the given pattern based on the information we have. At the second step, we update our weight based on a predefined distance of our prototype from the original pattern.
Note that the *h* function that is used in the updating is analogous to gradient descent in artificial neural networks. However, normally we will use Manhattan distance here instead of Euclidean to preserve the topological structure.
After the above explanation, I know some of you are still unclear about how it works or how the mathematical formula works, so do not hesitate to check out the following links:
Can you show me an example?
First, we generate four sets of 3-dimensional random Gaussian vectors with 1000 points in each set, each with a variance of 0.1. Then we center the data sets at (0,0,0), (0,7,0), (7,0,0), and (7,7,0), respectively.
We will train a SOM with 100 prototypes trying to cluster the data into 4 clusters.
Source codes are uploaded here.

We will use the parameters as suggested by the left to train and test the data.
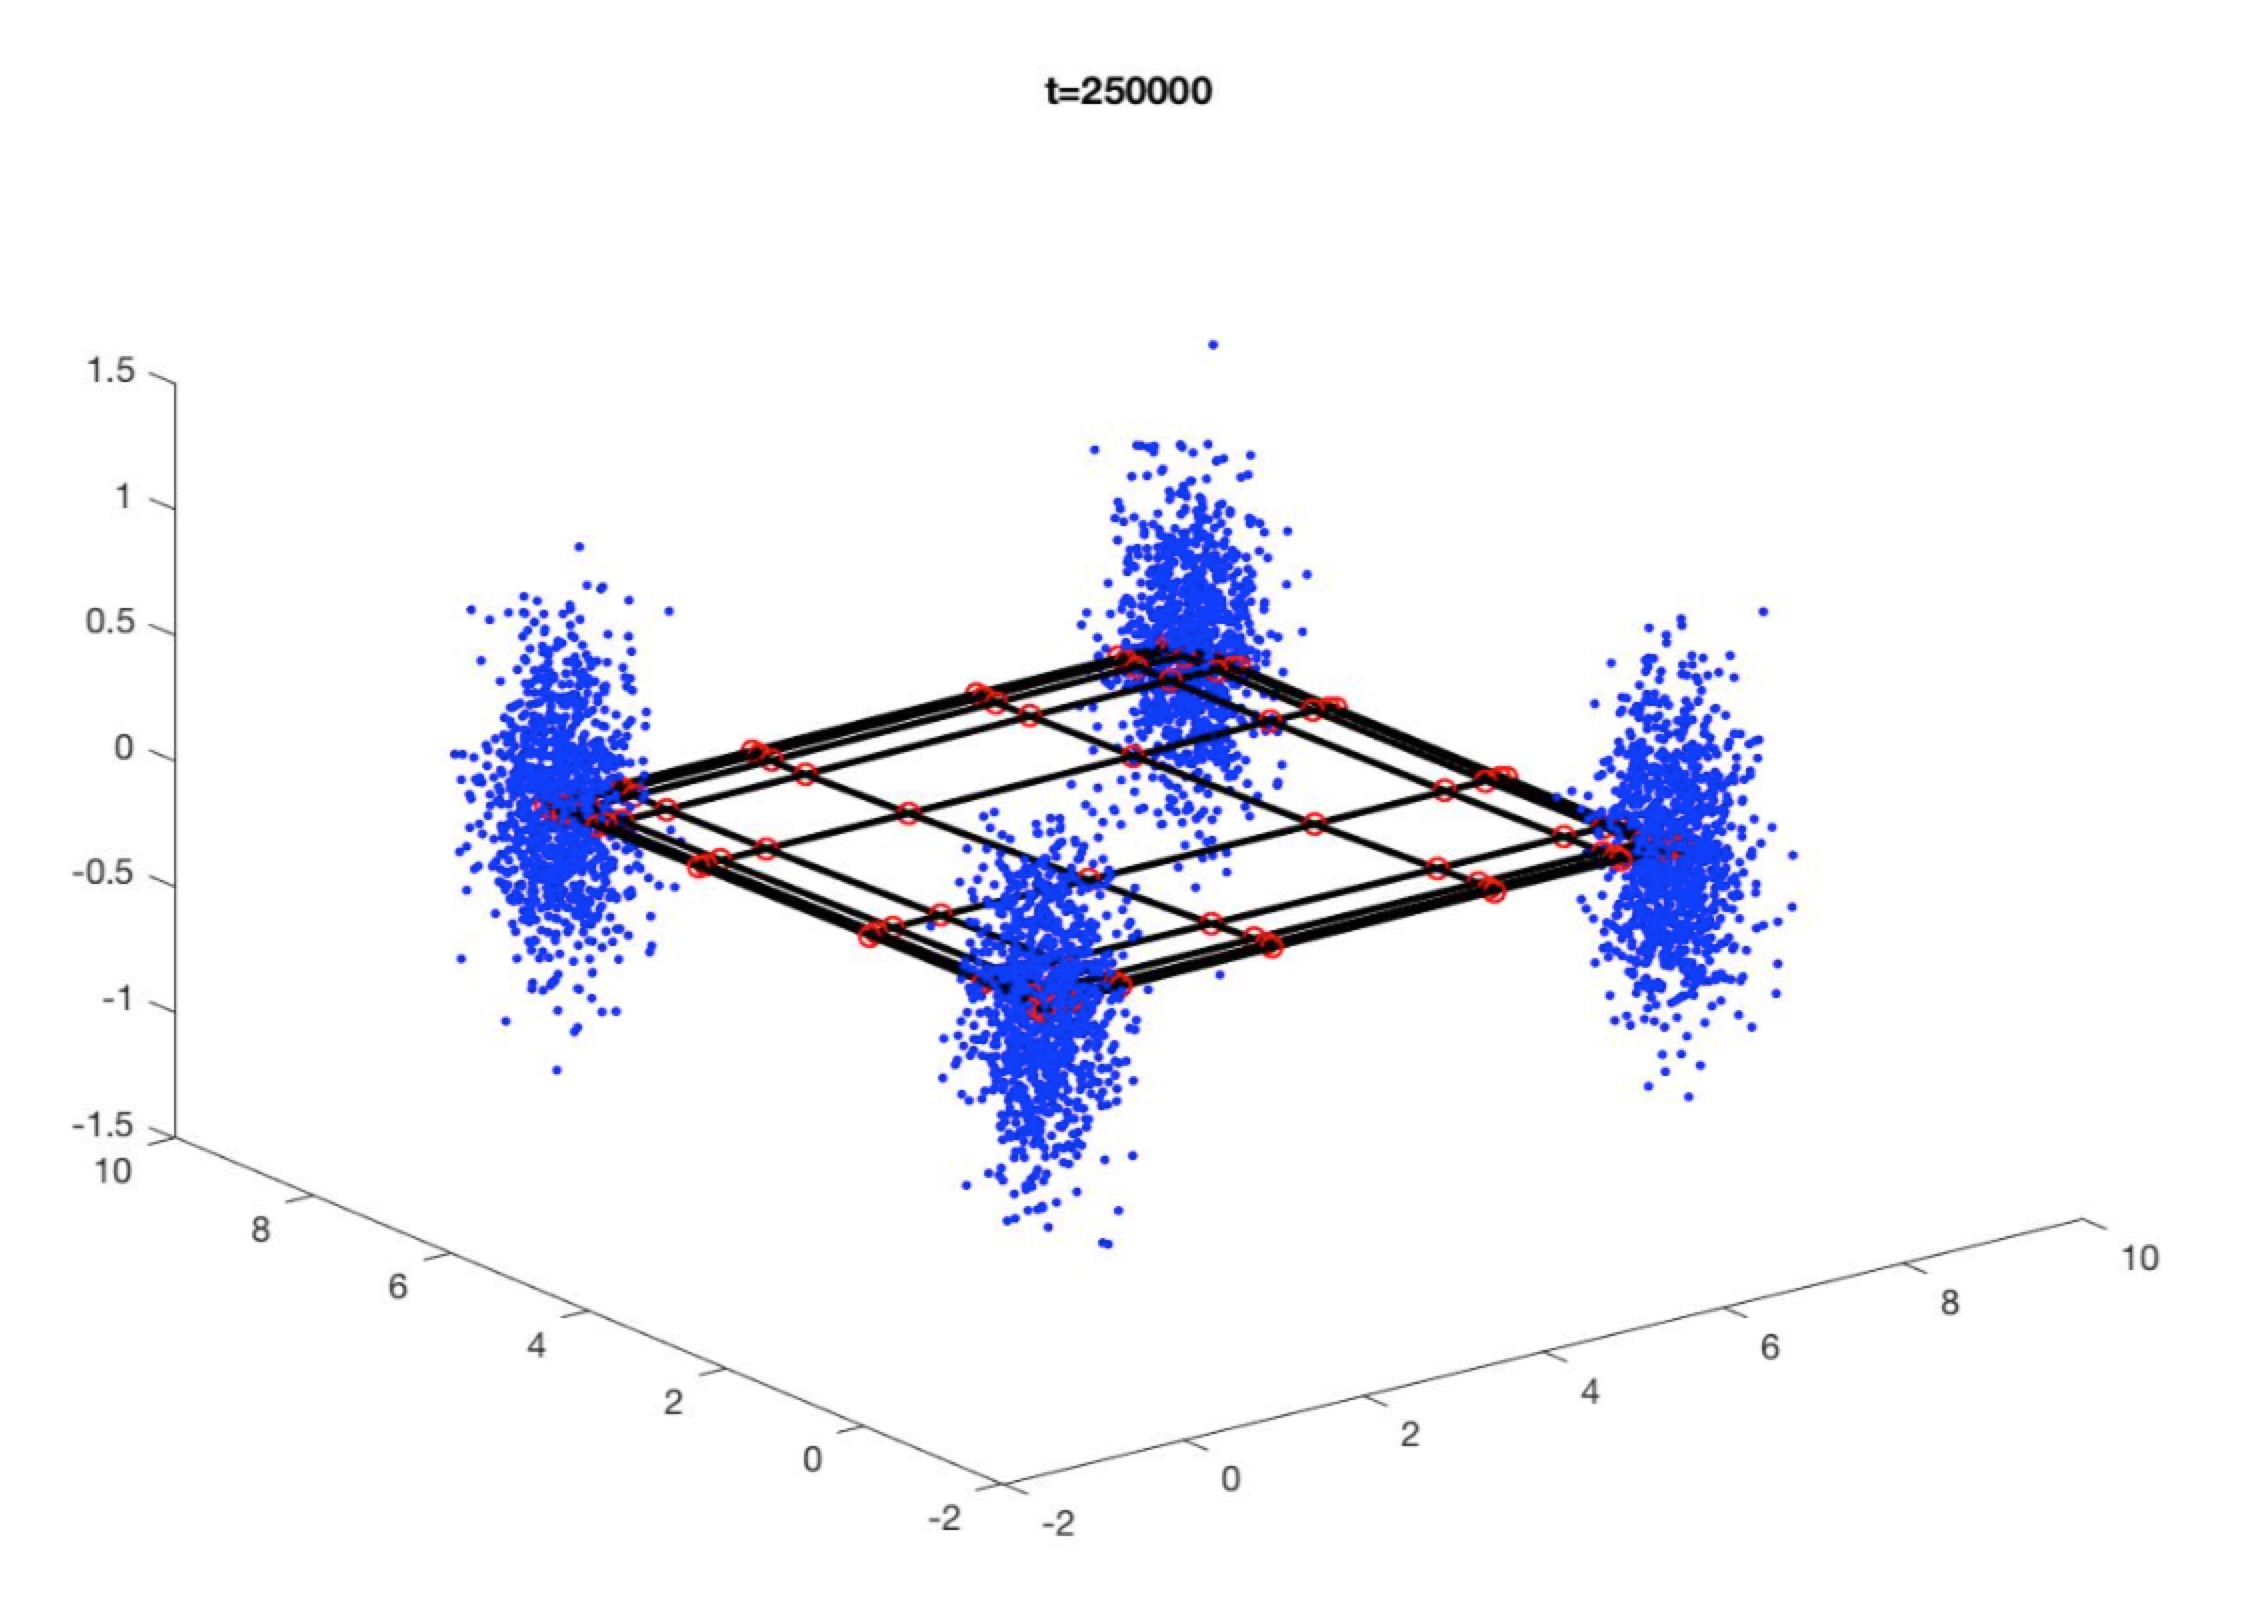
Note that in this graph, blue dots are generated points that are to be clustered. Red dots represent prototypes For illustration, we connect them by black solid lines.
From the result, we can see that most prototypes are bundled and gathered to four corners. Because there is no cluster in the middle, the grid is stretched out tightly so that maximum of prototypes can match the data points optimally.
Source code is here.
Reference
http://www.cs.nott.ac.uk/~pszqiu/Teaching/2004/G5BNEC/G5BNEC-SOM.pdf
https://link.springer.com/referenceworkentry/10.1007%2F978-3-540-92910-9_19
https://www.sciencedirect.com/science/article/pii/S0925231298000307